Build into the network, not over it.
WildPatch maps the habitat patches and corridors surrounding any site, then guides a plan that keeps the ecological web connected — and alive.
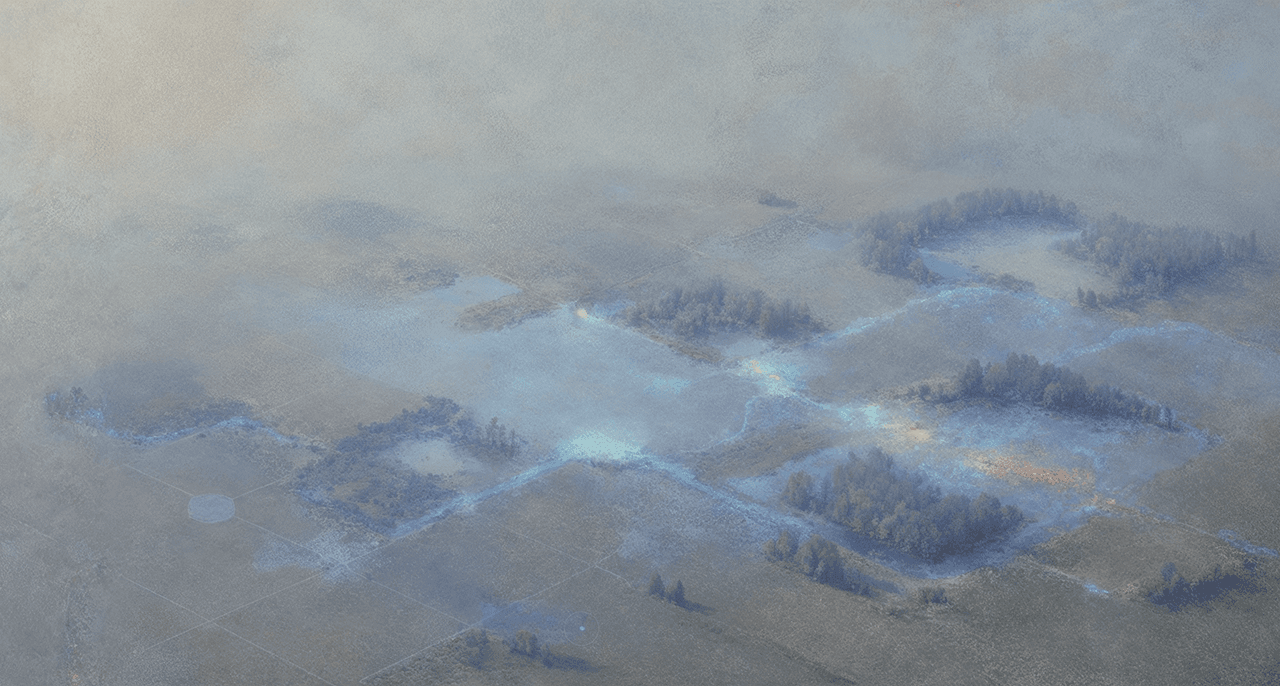 patch 04 · wetlandcorridor +2.1 km
Everything the land already knows, read back to you.
One model of the living landscape — habitat, hydrology, species movement and connectivity — kept current as your design evolves.
Habitat patch mapping
Detects and classifies every habitat patch around your site from multi-source imagery, then tracks how each one changes through the seasons.
Connectivity modeling
Cost-surface analysis scores how easily species move between patches, surfacing the corridors your plan must protect.
Species networks
Movement graphs for indicator species across the surrounding mosaic — see which patches carry the network.
Integration scoring
A single index for how well a design joins its biological context, updated live as the plan changes.
See your site in its living context.
Open any parcel and WildPatch overlays the real habitat patches, water and movement corridors around it — so every design decision is made against the landscape as it actually behaves.
live patch & corridor detectionEvery panel, one living model.
The same panels you work in — framing, habitats, connectivity and a native-plant palette — all reading from one model of the landscape.
Run an analysis without leaving your shell.
Point WildPatch at a parcel file and get patches, connectivity and corridor recommendations back as structured output — ready to pipe into the rest of your pipeline.
Read the docsShipping, season by season.
Complementary planting palette
Plant–fauna interaction networks turn each site's habitat targets into a species palette — the method now runs end to end, boundary to planting plan.
Site Studio — frame a patch, see it in 3D
Draw or upload a KML boundary, check data sufficiency, then open the site in the 2D-in-3D viewer with its true footprint and zone rings.
Honest habitat coverage
Completeness scored against FloraVeg references and threat from the European Red List of Habitats — with the gaps and uncertainty shown, never hidden.
Wetland hydrology layer
Seasonal water extent and flow direction now factor into corridor cost surfaces.
Species movement modeling
Indicator-species movement graphs across the surrounding patch mosaic.
Corridor cost-surface editor
Adjust resistance weights by land-cover class and re-run connectivity live.